CRM
Improve Customer Acquisition and Retention.
"We know you, and we value you."
Customer Relationship Management(CRM)
Customer relationship management (CRM) is software that
manages your relationships with customers. A CRM system isn’t just one solution, but
it tracks leads, closes opportunities, and provides accurate forecasts. The goal of
CRM is to support strong, productive, and loyal relationships with customers through
informed and superior customer experiences at every stage of the customer journey.
CRM system evolves by constantly gathering customer data,
analyzing that data, and using the knowledge gained to deepen relationships and
improve business results.
CRM software supports you beyond the sales process, which is crucial to business performance. With the in-depth knowledge of the customer, companies can:
-
Offer and sell new, add-on products—at the right time in the right way at the right price
-
Help service teams resolve issues faster
-
Help development teams create better products and service
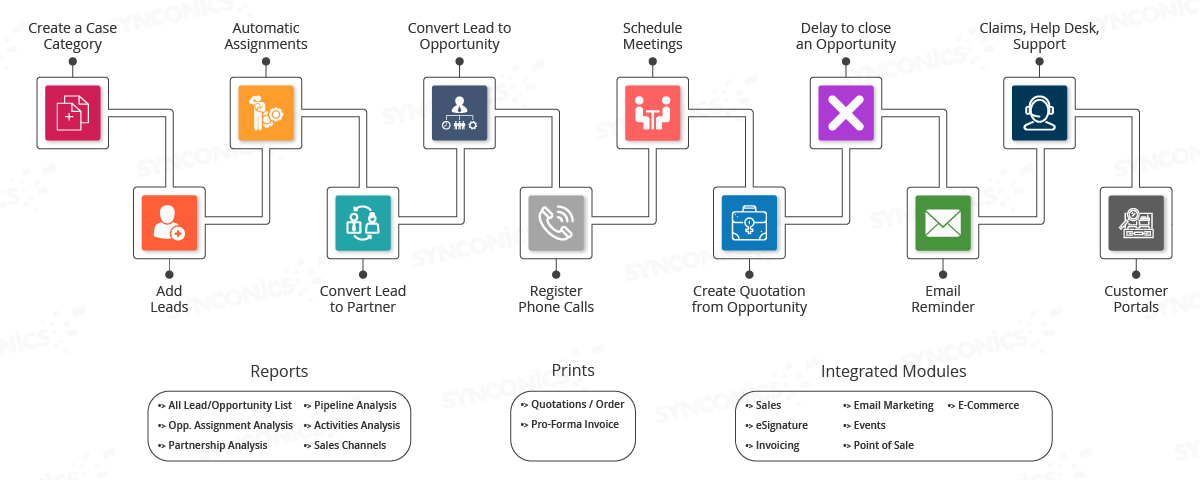
CRM Dashboard
"Align all needed information in a more methodology view."
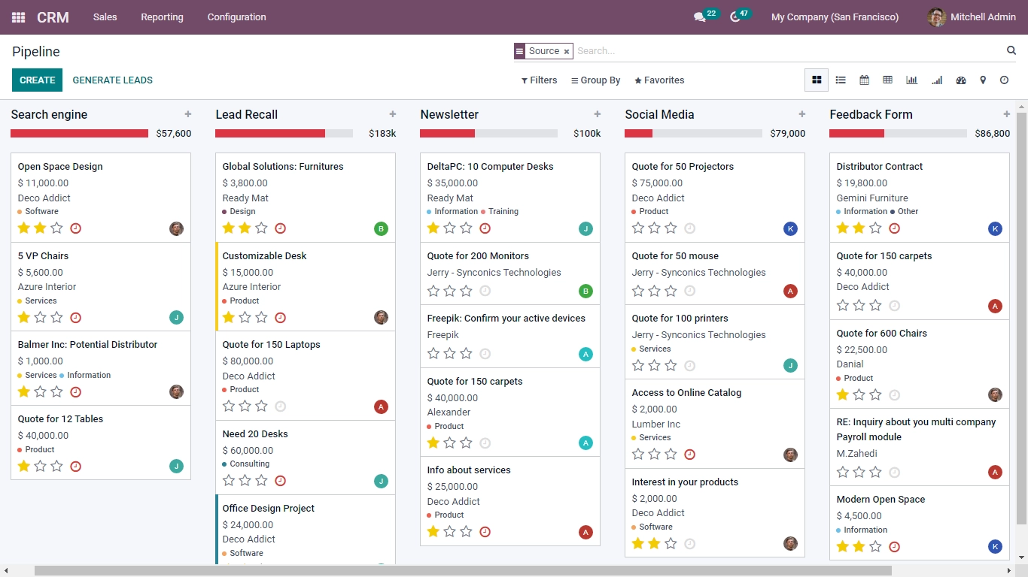
Use predefined dashboards or build your own with the advanced
reporting engine to get a picture of your business at a glance. Kanban, lists, graph,
activity, pivot and much more to get systematic real time overview of all stages of
sales.
Moreover, you can change the layout as per your interest with
configurable tools such as filters which make your search easy (filter your leads,
sales, pipelines as per your needs) and you can even share filters with your team.
-
Drag and drop interference
-
Clear overview of opportunity pipeline
-
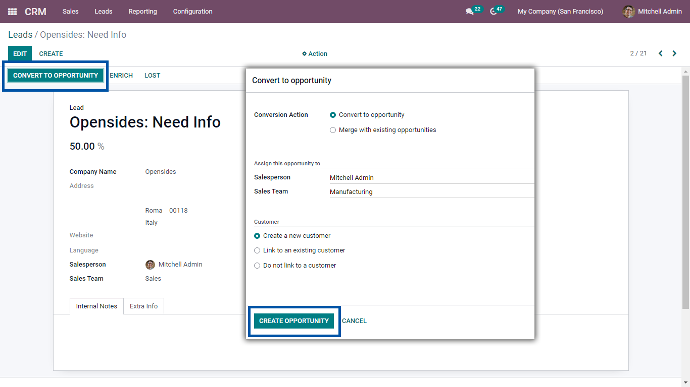
Automatically merge opportunity into existing one

Reports and analyze
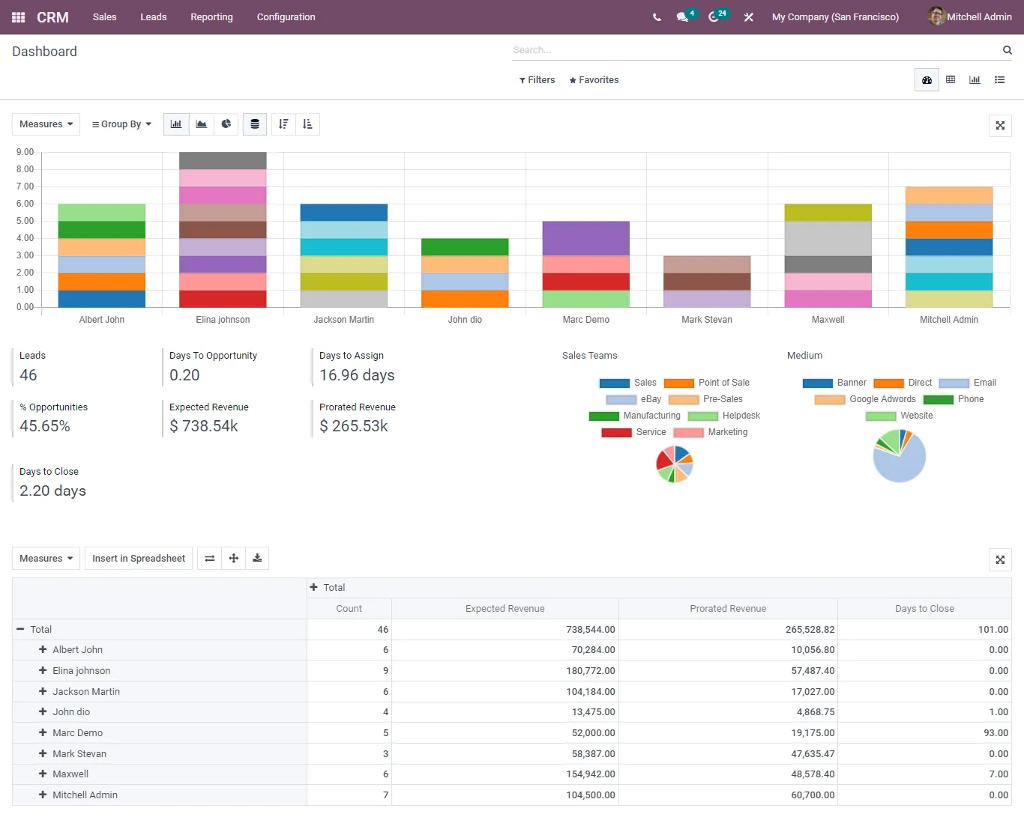
Super cool and easy to view all leads, scheduled activities, and task performance as well as a quick overview of what's been happening in your team. Use actionable data to get insights needed in order to make smart and better decisions
-
Anyone can create and share real-time reports and flow charts.
-
Easily review your performances & next activities.
-
Know exactly how you perform compared to your monthly targets.
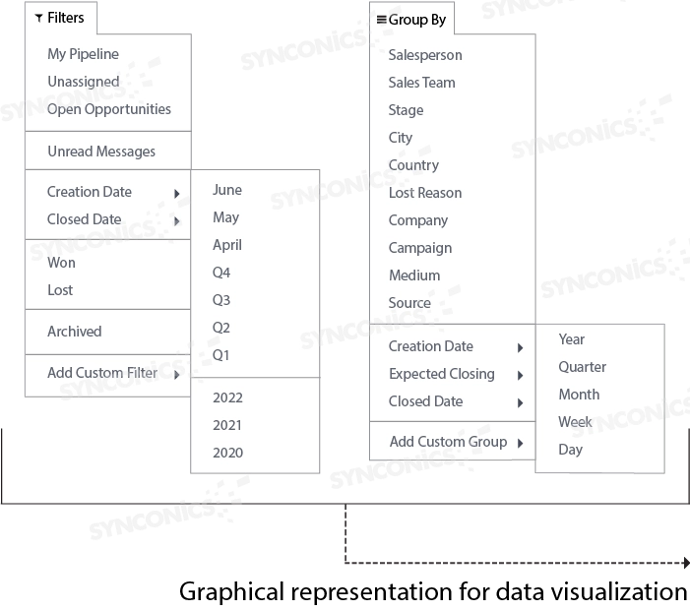
The following functionality of sorting statistical data is going to remain common in all the types of CRM reports based on different aspects of CRM operations.


Display information of numbers of leads, days to opportunity, days to assign, opportunities, expected revenue, prorated revenue and days to close in an organized manner along with various view formats such as chart types: Line, Bar, Vertical, Horizontal, Pie chart, Doughnut, Polar Area chart and List view. Furthermore, get the required/ specific information using numerous filters, group by, measures and even tags too as well as download them in pdf format.
Distinguish reports
using
FILTERS
such as My
activities, Unassigned, My assigned partners, lost, with
time duration like month vise, yearly, quarterly, month,
week, date, late activities, today activities, future
activity, etc. Apart from this, users can create/ add
their dynamic filters.
Club same set of
information using
GROUP BY
option:
Salesperson, Sale team, city, company, assigned partner,
campaign, medium, source, with time duration like
months, yearly, quarterly, month, week, to &
from date, late activities, today activities, future
activity, etc. Apart from this, users can create/ add
their dynamic filters.
View a
GRAPHICAL
representation of
reports using a Bar chart, Line chart, and Pie chart.
These charts can be configured in ascending order as
well as descending order.
Categorize CRM
reports as per various domains of
MEASURES
like automated
probability, bounce, days to assign, days to close, days
to convert, exceeded closing days, expected revenue,
probability, prorated revenue, and much more.
Furthermore, an option name “Count” is provided which
will select all mentioned measure domains altogether.
Mark your frequent
CRM report search as a favorite or even can create
custom
FAVORITE
fields too.

Forecasting reports in CRM provide valuable insights into lead and sales analysis, helping estimate upcoming revenues. These reports offer various features such as filters, grouping options, graphical representations, and customizable arrangements to suit specific priorities.
The first screenshot showcases a bar graph representation of a CRM forecast report. It summarizes leads generated from different countries and their corresponding progress stages, including won, new, qualified, and proposition. This allows authorized personnel to easily analyze lead stages across countries.
The second screenshot displays a line graph representing a CRM forecast report. It illustrates the types of social media platforms (such as Facebook, email, LinkedIn, websites) in relation to various cities. This helps identify different leads originating from specific cities through different mediums.
The third screenshot presents a pie chart in a CRM forecast report, showcasing the number of leads generated on a monthly and yearly basis. This quick visual representation enables authorized individuals to track the months and years with the highest lead generation.
Lastly, the screenshot of the pivot view demonstrates CRM reports on leads, their stages, total count, sales team, salesperson, and their distribution across months and years. These reports are also useful for calculating prorated sales values.
Overall, CRM forecasting reports provide valuable analytics and visual representations that aid in understanding lead progression, revenue estimation, and sales team performance, facilitating data-driven decision-making within the organization.
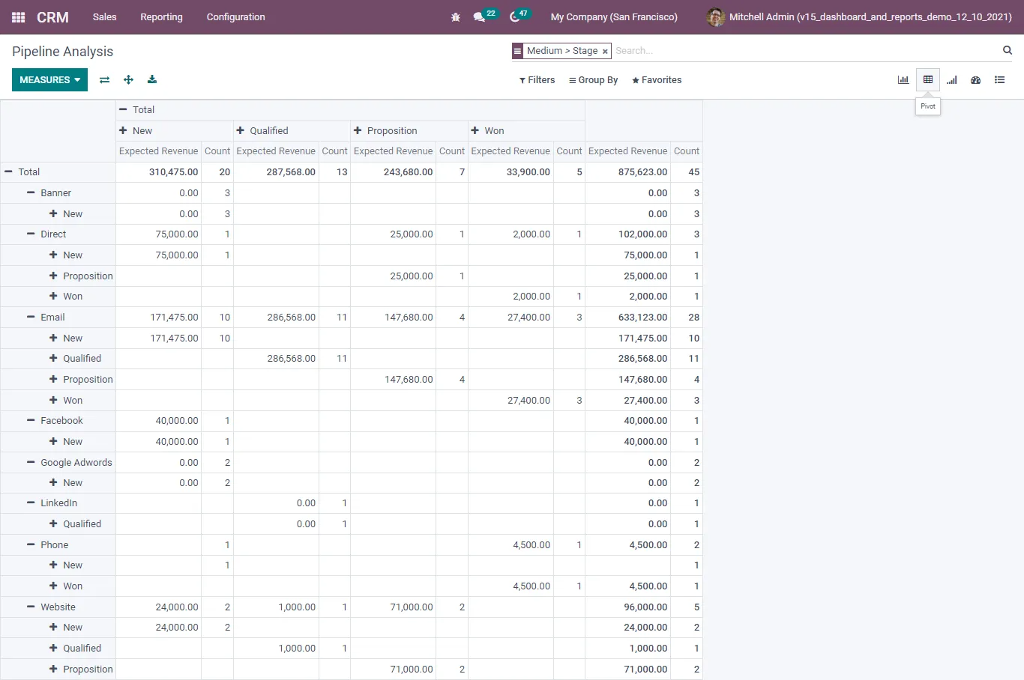
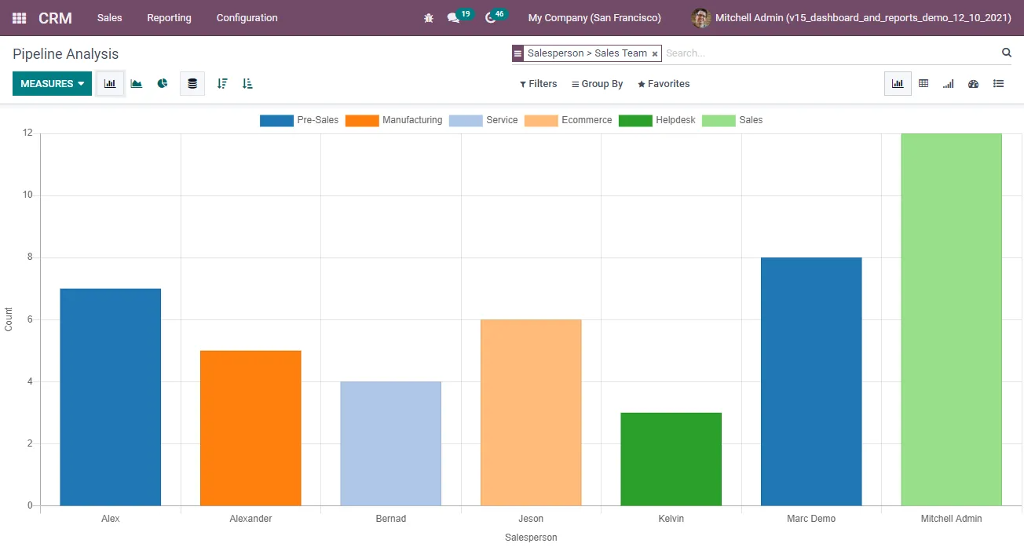
Pipeline reports can be
generated for the pipeline stages of sale, sales team, and
their expected revenue. You can use filters, measures,
groups by, and different types of graphs to analyze and
compare company revenues .
The pivot view of CRM
pipeline reports briefs about the number mediums of lead
such as emails, website, phone, LinkedIn, banner and much
more along with leads stages such as new, qualified,
proposition, won as well as their expected revenue and total
count are also defined.
The pipeline reports can
be generated in bar graph, pie chart and in line graph with
the selected filter options.
- Pipeline Reports’ in Bar Graph
- Pie Chart reports
- Line Graph report
Bar Graph
The
report displays the details of various activities of
salespeople in the sales team.
Pie
Chart
The report displays briefs about CRM
leads, their opportunity and stages such as New, Qualified,
Proportion and won.
Line Graph
The
report describes the details of Salesperson, sales team,
company and stages wise.
List View
NEED TO CHANGE CONTENT OF THIS PARAGRAPHDD
Fes of leads across the
countries.
The above screenshot image represents
the line graph of a CRM forecast report, which displays
types of social media mediums like Facebook, email,
linkedin, websites and much more in context with cities. E.g
Different leads come from numerous cities, through various
mediums.
The pie chart of a CRM forecast report,
which displays month along with year wise number of leads
generation. At a glance, an authorized person can keep track
of the year and month in which highest leads were
generated.
The screenshot of pivot view
represents CRM reports of lead, their stages, total count,
along with sales team, salesperson month and year wise.
Moreover, reports are beneficial for calculating prorated
value of sales.

Accounting 2
To be successful your content needs to be useful to your readers.
Accounting 3
Start with the customer – find out what they want and give it to them.
Odoo CRM Key Benefits
Customer
Address Book
Get a clear address book shared amongst your salesperson.
Customer
Preferences
Set customer preferences easily: language, delivery methods, financial data, etc.
Multi-Address
Have multiple addresses and contacts for a single company.
Full History
Get the full history of activities attached to any customer: opportunities, orders, invoices.
Cohort
Analysis
Keep track of the evolution of your KPIs over
time and detect trends.
Leads
Analysis
Get statistics about your sources of leads to
evaluate the ROI of your marketing campaigns.
Performance
Analysis
Check your Win/Loss Ratio
Reports
Keep an eye on your workflow, and measure it
by excessively complete reports of pipe analysis, activities analysis,
and sales channels.
Multi-Channel Lead Generation
“Combines data from various sources,
with single Interference”
A multichannel lead generation system collects leads from different sources and organizes them in a single interface, so the sales team can stay organized and reply faster. These channels include: Email, Social media, Live chat, Telephony, Web form, Marketing campaigns and Promotional programs.
Lead Management with advanced tools
“Analyze, Realign , and Accelerate all our
leads.”
-
Multiply leads into opportunity
-
Define rules to assign leads to the right sales team or person
-
Lead Nurturing
-
Lead Scoring
-
Lead enrichment
-
Import Leads
-
Deduplication
-
Schedule based Follow up on Leads
-
URL tracker
Opportunity Pipeline Management
“Use an opportunity to make management workflow more efficient”
-
Set up customized stages for each sales team
-
Custom stages on Lead pipeline
-
Drag and drop interface
-
360 Degree View on all CRM actions
-
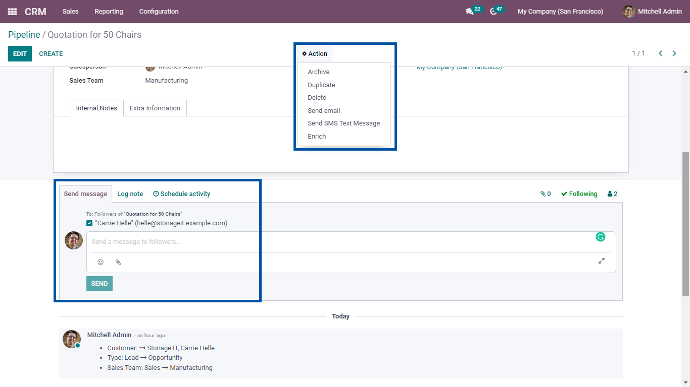
Schedule activity on each Opportunity
-
Log calls and activities on Opportunities
-
Analyze lost reasons on your opportunities
Scheduler and analyze activities
“Invest in customers' time, makes your
business divine.”
Schedule activities from the Calendar such as calls, meetings,
mailings, and quotations. In the scheduler use endless themes for all your plans, edit them
as per your needs and choices.
-
Effortless Scheduling and rescheduling within a seconds
-
Club all meetings just a once
-
Reminder of meetings
-
Track, log and analyze the activities of your team
Stay connected to your customers
“Analytics , Engagement, with modern intelligence tools.”
Real-time messaging to enhance collaboration Nourish a healthy
bond with your existing customers, create new prospective customers and win back your former
customers.
-
Easy Customers preferences approach
-
Live chat and group discuss with customers
-
Create custom email template for most common communications
-
Get custom alerts for follow ups
-
Sustain lifelong bond with customers
Sales Management
“Turn your sales growth into success”
-
Optimized overview of all sales on one big screen
-
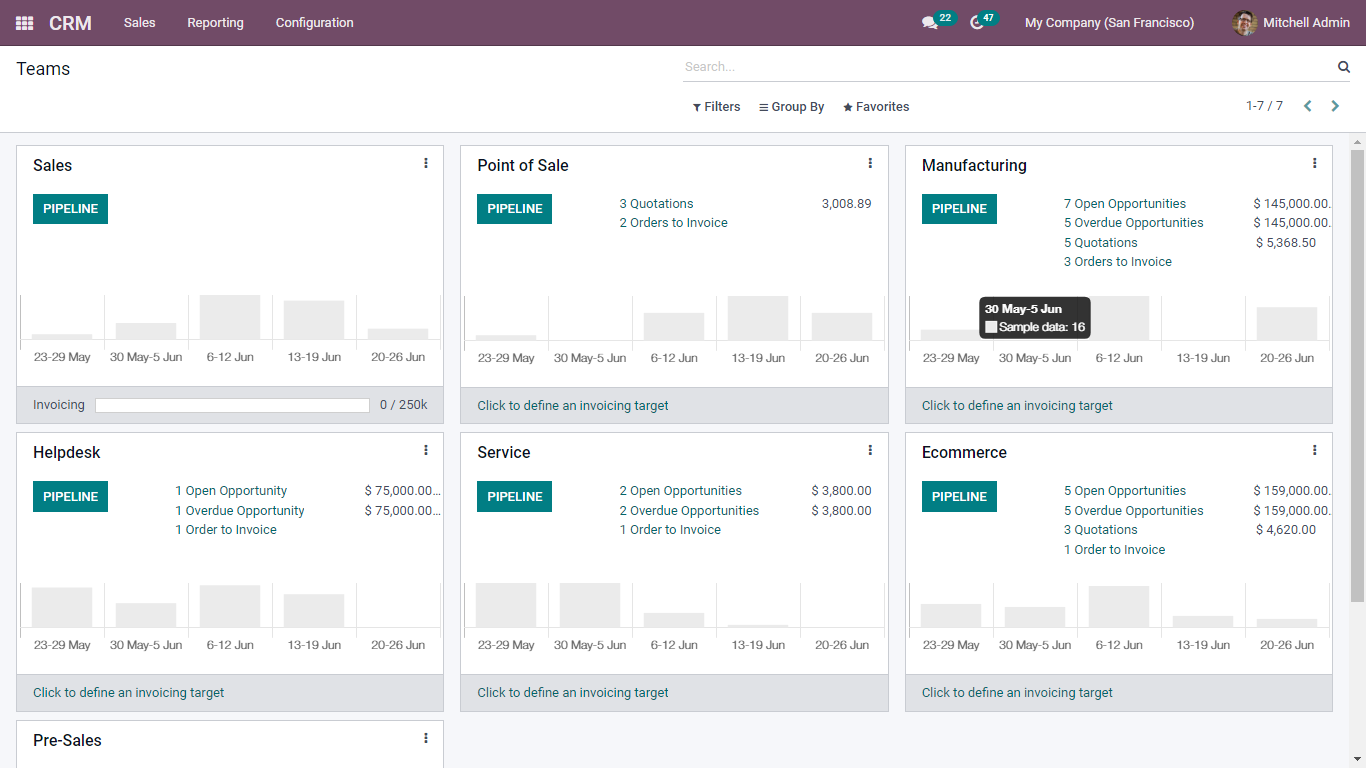
Create , edit your sales team within seconds
-
Manage multiple sales team
-
Use of Updated Modern User Interference
-
Get all vital tools for managing all your sales
Fully Integrated with other Odoo Apps
 Sales
Sales
Keep track of all interactions with your opportunities
and customers and improve your sales cycle.
 Sign
Sign
Keep track of all interactions with your opportunities
and customers and improve your sales cycle.
 Invoicing
Keep track of all interactions with your opportunities
and customers and improve your sales cycle.
 Email Marketing
Keep track of all interactions with your opportunities
and customers and improve your sales cycle.
Ready to supercharge your Businesses.
Jump-start your
implementation and drive ROI by collaborating with industry experts,
consultants, and
support engineers throughout your
journey.
- Installation & Configuration
- Training
- Customization
- Support
